4 Churn prediction and retention strategy
In the last chapter, the choice of the variables that have the highest impact on the churn rate was discussed. In this chapter, we use those variables to predict whether a customer will decide not to renew their museum card in 2014. After determining the prediction model with the highest performance, we will then evaluate the best strategy on how to reach by phone and/or email those who are most likely to churn, given our budget.
4.1 Prediction models
The goal of the prediction model for this task is to predict the churn rate of the museum card holders in 2014 based on the their entrance history, demographic information and amount paid in 2013. Any prediction needs to be trained on a set of data called training set, but evaluated on new data the model did not see during training called test set. This is done to avoid overfitting, or in other words, to avoid the model to learn the training data by heart and not being able to generalize to unseen data.
We split the overall dataset into 60% training set and 40% test set. As table 4.1 shows, the proportion of churners is around 38%, which does not indicate an overly unbalanced dataset. As a consequence, no special treatment was deemed necessary to deal with the imbalance on the training side.
| churn | n |
|---|---|
| 0 | 20693 |
| 1 | 7978 |
For the choice of the models, we decided to compare the performance of some of the most widely used classification algorithms, namely logistic regression, whose inference analysis is contained in the previous chapter, conditional inference trees, random forest and C5.0 with boosting.
The performance of the models on the test set can be seen in Figure 4.1. The ROC curve is a plot of the true positive rate, or the proportion of churners correctly classified as such, against the false positive rate, or the proportion of non-churners incorrectly classified as churners. The closer the curve is to the top left corner, the better the model. The area under the curve (AUC) is a measure of the overall performance of the model, with a value of 1 indicating a perfect model and a value of 0.5 indicating a model that is no better than random guessing.
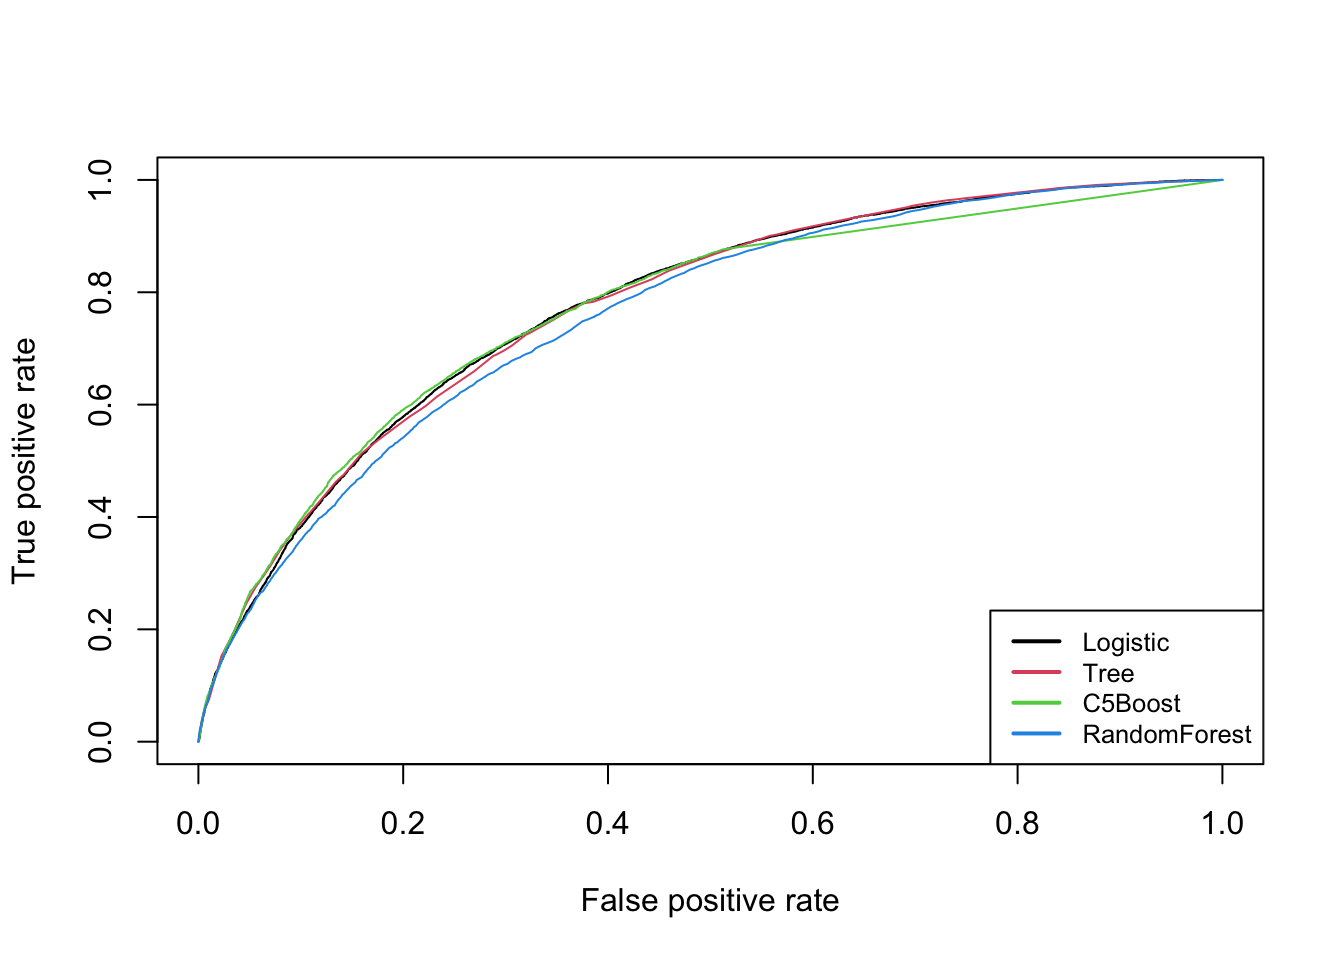
Figure 4.1: ROC curves of models
We can see that the logistic model has the best performance for most of the range, together with the conditional inference trees and C5.0 model with boosting. Table 4.2 summarises these results numerically in terms of precision, recall, AUC, F1 score and accuracy for each model.
| model | precision | recall | auc | f1 | accuracy |
|---|---|---|---|---|---|
| Logistic | 0.7832142 | 0.9159136 | 0.7729627 | 0.8443821 | 0.7563392 |
| Tree | 0.7836626 | 0.9202629 | 0.7722978 | 0.8464872 | 0.7590946 |
| C5Boost | 0.7868784 | 0.9146088 | 0.7668507 | 0.8459493 | 0.7595829 |
| RandomForest | 0.7919042 | 0.8792345 | 0.7569467 | 0.8332875 | 0.7460849 |
Beyond the AUC which was already discussed, accuracy is the simplest measure of performance to look at. It is possible to see that the boosting model has the highest one, followed by the decision tree and the logistic regression. However, accuracy is not always the best measure of performance, especially when the dataset is a bit unbalanced. For this reason, the F1 score is also reported, which is the harmonic mean of precision, or the ratio of correctly predicted churn cases to the total number of positive predictions made by the model, and recall, or ratio of true positive predictions to the total number of actual positive cases. In this case, the conditional inference trees have the highest value.
For the task of this project though, the cost of a false negative is not the same as the cost of a false positive. Failing to identify a churning customer results in a loss of revenue far greater than the cost of contacting a customer who is not going to churn. Consequently, the recall is the most important metric to look at.
The conditional inference tree has the highest recall and this is the model that will be used for defining the retention strategy.
4.2 Retention strategy
The goal of the retention strategy is to define a set of rules to decide which customers to contact and how to contact them. The rules are based on the probability of churn predicted by the model, the cost of contacting a customer and the customer’s value to the museum association for the year 2014. Moreover, the association is bounded by a budget of 5,000€ to spend on contacting customers.
The cost of contacting a customer varies by method. The cost of sending an email is 0.15€, while the cost of calling a customer is 1€. The difference in cost is also reflected in the response rate, which is 15% for emails and 35% for phone calls.
For the value of a customer, the initial revenue is given by the amount paid by the customer for the subscription in 2013. This means that we are assuming that the customer will pay the same amount in 2014 and will be eligible for the same discounts. From this initial revenue it is then deducted the amount of money that the association had to pay to the museums (50% of the ordinary ticket price) every time the customer visited a museum in 2013. The resulting value is the net revenue for the association, projected to 2014, calculated for each customer.
4.2.1 Phone-only and email-only strategies
Initially, a simpler model was considered, where the customers were sorted in descending order by their probability of churn and the association would contact them only either by phone or by email.
The customers most likely to churn are contacted before the ones less likely to churn. If the contacted customer is a churner, then the association gets 35% or 15% the subscription revenue, depending on the response rate of phone calls vs emails, minus 50% of the admission tickets minus the cost of contacting the customer. If the contacted customer is not a churner, then the association will get zero revenue from the campaign, since the customer would have renewed their subscription anyway, but will still have to pay the cost of contacting the customer. The cumulative profit is calculated by summing the profit of each customer contacted in order. It is possible to see the two extreme cases in Figure 4.2.
As we move to the right of each curve, by contacting more and more people, the cumulative profit increases but customers are increasingly not churners. The association starts getting less and less revenue from them; this why both of the curves first flatten out and then start decreasing, as the cost of contacting customers is higher than the revenue generated by the churners. The phone-only strategy, due to its higher cost, has a steeper decrease than the email-only strategy.
The chart also shows the area under the budget constraint of 5,000€ in red. We can see that all the customers could be reached by email, but only 17% of them could be reached by phone. This area allows us to observe how, despite having a higher cumulative profit without a budget constraint, contacting predicted churners only by phone is not the best strategy in this case, since we can see that the maximum of cumulative profit of the email-only strategy is slightly higher than the maximum of the phone-only strategy at the budget constraint.
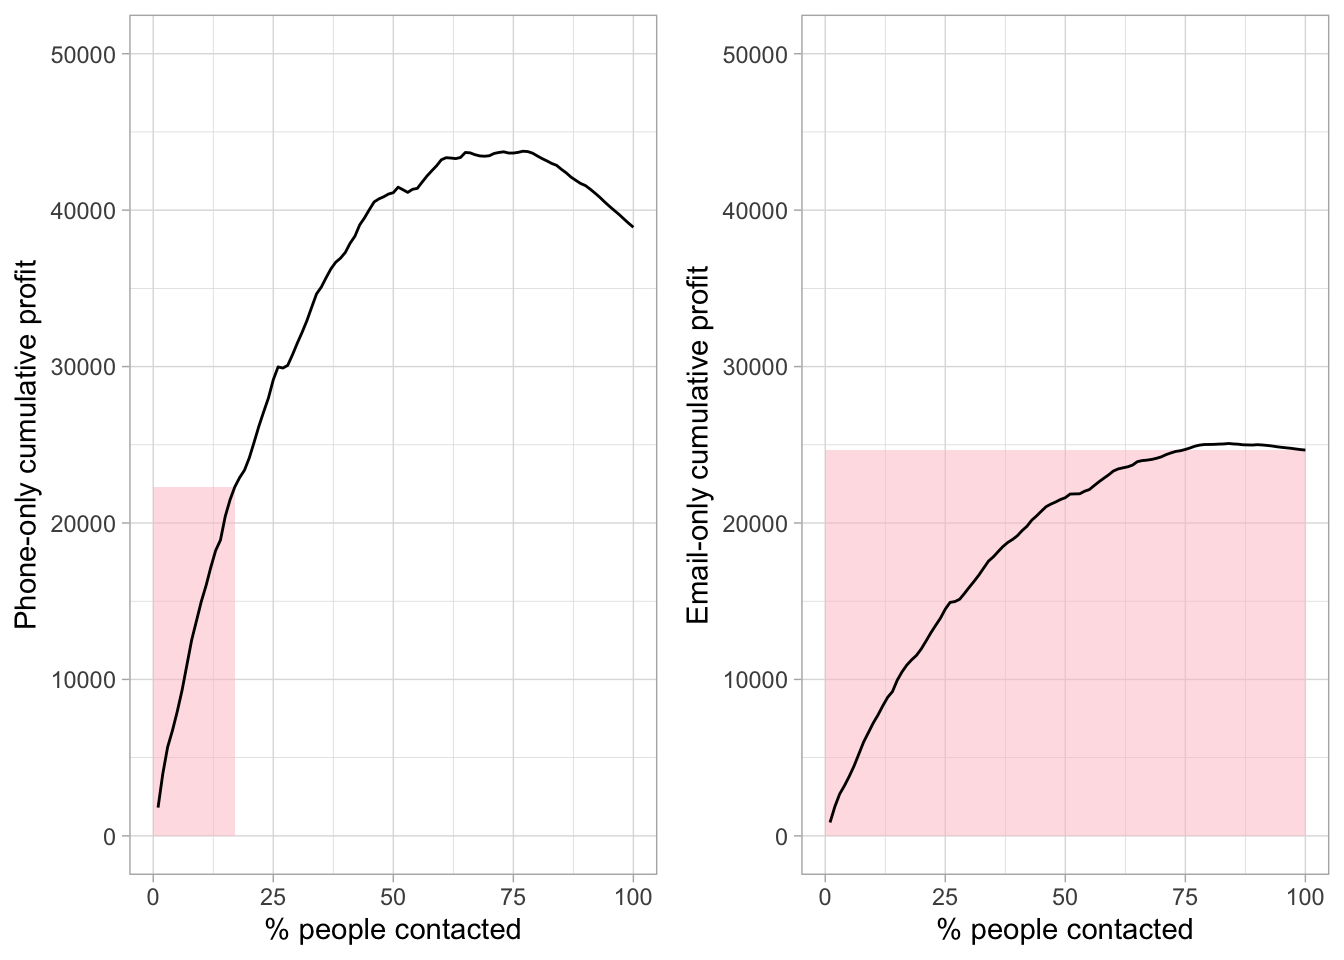
Figure 4.2: Phone-only and email-only cumulative profits with area under budget
Since the customers are sorted by their probability of churn, it is trivial to find the score cutoff that the association would use if it wanted to exhaust the budget. Tables 4.3 and 4.4 summarise the results, with the cutoffs highlighted in pink and the cumulative values of churners, cost, revenue and profit. With a cutoff of 45%-50%, the association would be able to contact between 4,371 and 5,500 customers by phone, generating a cumulative profit between 20,777€ and 23,522€. Meanwhile the email cutoff associated with the highest profit under the budget stands at 5%-10%, with a profit between 24,923€ and 24,993€. As stated before, this last one would in fact be the best strategy in this simpler case. However, this would not be an efficient strategy, since the budget would not be fully used.
| scoreBin | contacted | churners | cum_cost | cum_revenue | cum_profit |
|---|---|---|---|---|---|
| 0.9-0.8 | 360 | 294 | 360 | 2758 | 2398 |
| 0.8-0.7 | 824 | 607 | 824 | 6303 | 5479 |
| 0.7-0.6 | 2114 | 1464 | 2114 | 13553 | 11439 |
| 0.6-0.5 | 4371 | 2721 | 4371 | 25148 | 20777 |
| 0.5-0.45 | 5500 | 3250 | 5500 | 29022 | 23522 |
| 0.45-0.4 | 6640 | 3759 | 6640 | 33802 | 27162 |
| 0.4-0.35 | 9730 | 4903 | 9730 | 44296 | 34566 |
| 0.35-0.3 | 11511 | 5495 | 11511 | 48878 | 37367 |
| 0.3-0.25 | 13143 | 5985 | 13143 | 53625 | 40482 |
| 0.25-0.2 | 16223 | 6694 | 16223 | 58221 | 41998 |
| 0.2-0.15 | 18333 | 7107 | 18333 | 61713 | 43380 |
| 0.15-0.1 | 22097 | 7617 | 22097 | 65887 | 43790 |
| 0.1-0.05 | 26072 | 7907 | 26072 | 67441 | 41369 |
| 0.05-0.0 | 28671 | 7978 | 28671 | 67577 | 38906 |
| scoreBin | contacted | churners | cum_cost | cum_revenue | cum_profit |
|---|---|---|---|---|---|
| 0.9-0.8 | 360 | 294 | 54 | 1182 | 1128 |
| 0.8-0.7 | 824 | 607 | 124 | 2701 | 2578 |
| 0.7-0.6 | 2114 | 1464 | 317 | 5809 | 5492 |
| 0.6-0.5 | 4371 | 2721 | 656 | 10778 | 10122 |
| 0.5-0.45 | 5500 | 3250 | 825 | 12438 | 11613 |
| 0.45-0.4 | 6640 | 3759 | 996 | 14487 | 13491 |
| 0.4-0.35 | 9730 | 4903 | 1460 | 18984 | 17525 |
| 0.35-0.3 | 11511 | 5495 | 1727 | 20948 | 19221 |
| 0.3-0.25 | 13143 | 5985 | 1971 | 22982 | 21011 |
| 0.25-0.2 | 16223 | 6694 | 2433 | 24952 | 22518 |
| 0.2-0.15 | 18333 | 7107 | 2750 | 26448 | 23698 |
| 0.15-0.1 | 22097 | 7617 | 3315 | 28237 | 24923 |
| 0.1-0.05 | 26072 | 7907 | 3911 | 28903 | 24993 |
| 0.05-0.0 | 28671 | 7978 | 4301 | 28962 | 24661 |
The limitations of these two extreme cases are evident. First of all, as it was just said, the strategy is not efficient in terms of budget. Finally, the customers are sorted by their probability of churn, while weighting the probability of churn by the net value of the customer would be more appropriate and a combination of phone calls and emails possibly more rewarding. This is why a more sophisticated strategy was devised.
4.3 The combined strategy
The more optimal strategy that we designed and advise the association to follow is the following.
First, the customers are now sorted by the product of their probability of churn and their net value. This means that the customers who are most likely to churn and are most valuable to the association are contacted first. The customers who do not bring any value are the last ones to be contacted, if the budget allows it.
Second, the association would use a combination of phone calls and emails to reach the customers more likely to leave its service. From an economic point of view, we think that starting with phone calls for the most valuable customers and then switching to emails for the less valuable ones is the best foundation for this strategy, with still allows the possibility to contact all the customers by email or also a large part of them if it makes financial sense.
Defining a discretionary cutoff for the phone calls and emails, and for the amount of people to contact, was not deemed appropriate. The reason is that this would not be based on data, but on the intuition of the analyst, and could not be applicable to new datasets of the future years. Relying on data-driven decision-making is crucial for creating a sustainable strategy that can be adapted to changing circumstances over time. It ensures that the approach remains objective and relevant as customer behavior and business conditions evolve.
This is why a computation approach was chosen instead, with the development of an algorythm. What the algorythm does is try for each share of contacted customers the best combinations of phone and email percentages that maximize the cumulative profit under the budget constraint. The five top results are shown in Table 4.5.
| perc_contacted | phone_perc | email_perc | cum_cost | cum_profit |
|---|---|---|---|---|
| 0.41 | 0.19 | 0.81 | 4987.471 | 31039.71 |
| 0.34 | 0.24 | 0.76 | 4975.438 | 31009.04 |
| 0.30 | 0.27 | 0.73 | 4962.230 | 30960.86 |
| 0.37 | 0.22 | 0.78 | 4956.359 | 30952.97 |
| 0.38 | 0.21 | 0.79 | 4968.829 | 30941.49 |
First of all, we can see that no optimal combinations has either all phone calls or all emails. Instead, it is normally used a combination of the two, with the phone percentage being around 20% and the rest being emails.
The optimal one allows the association to contact 41% of the customers, with 19% of them contacted by phone and 81% by email. The cumulative profit is 31,039€ which around 6,000€ more than the email-only strategy and 7,000€ more than the phone-only strategy.
An important thing to note is that the budget is not perfectly exhausted with a cumulative cost of 4,987€ compared to the budget constraint of 5,000€. However, this difference is not attributable to a particular “choice” of the algorithm but to the fact that the iterations of algorithm are over the percentiles and thus with every move we are adding many more customers. The algorithm stops in that position because if it were to add more it would go over the budget constraint. So it is more of a error in precision than an actual choice in not using the whole budget. Instead, it is clearly seen how the algorithm tries to use as much as the budget as possible.
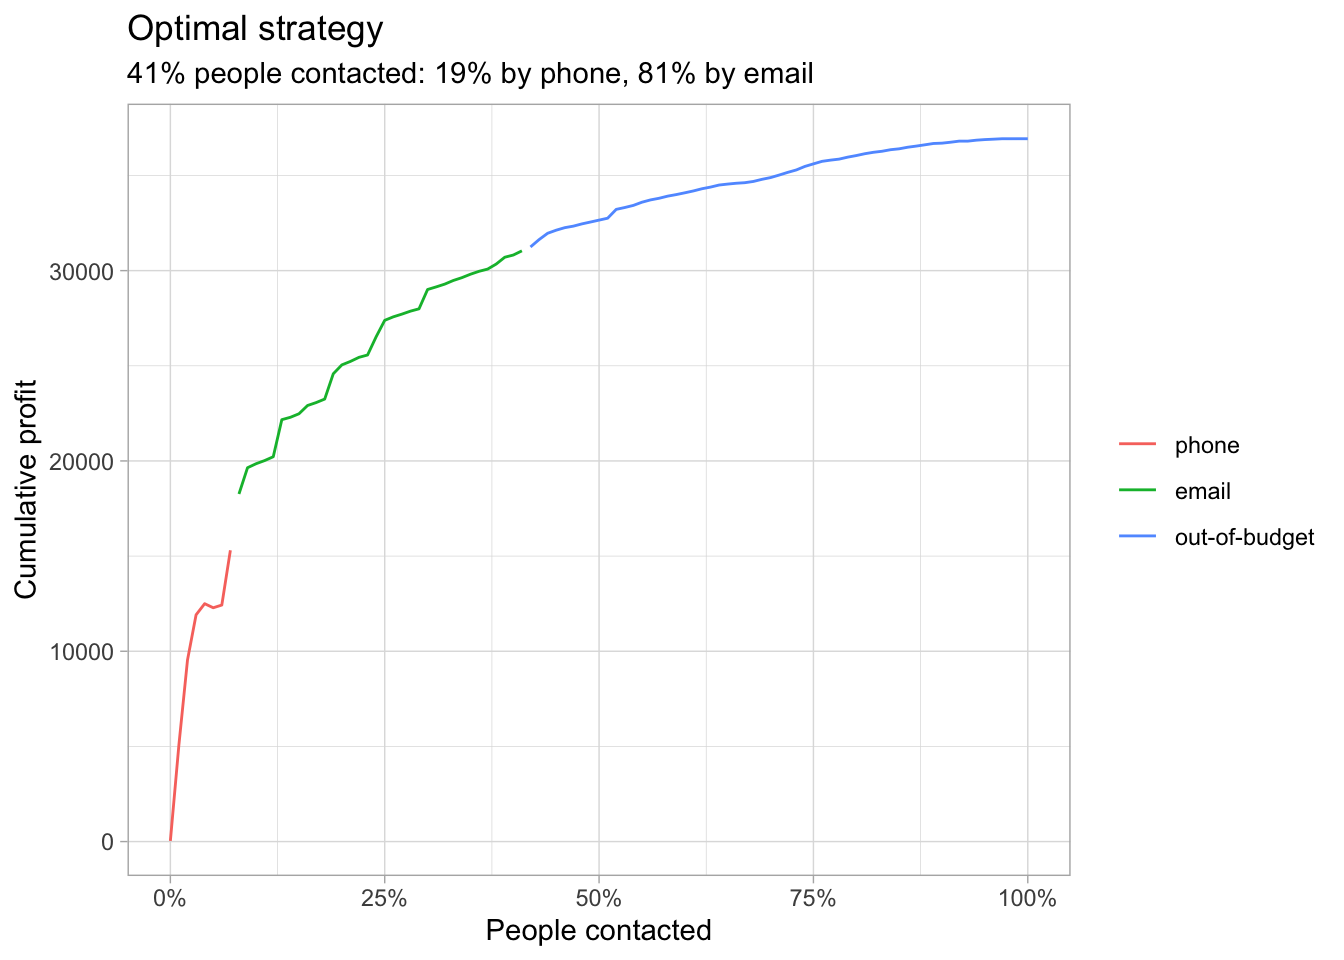
Figure 4.3: Optimal strategy
Figure 4.3 shows the curve of the cumulative profit of the optimal strategy. On it, we can clearly see, depicted with different colors, the phone, email and out-of-budget segments of the curve.
With this important findings, it is possible to state that a combination of the two contact campaigns, phone and email, is better than the extreme cases. Moreover, once more, these findings allow us to see how the association can only contact the customers which are more likely to churn and are more valuable, while discarding the ones which are less likely to churn and are less valuable. This is a very important aspect of the strategy, since it allows the association to save money and time, while still maximizing the profit.